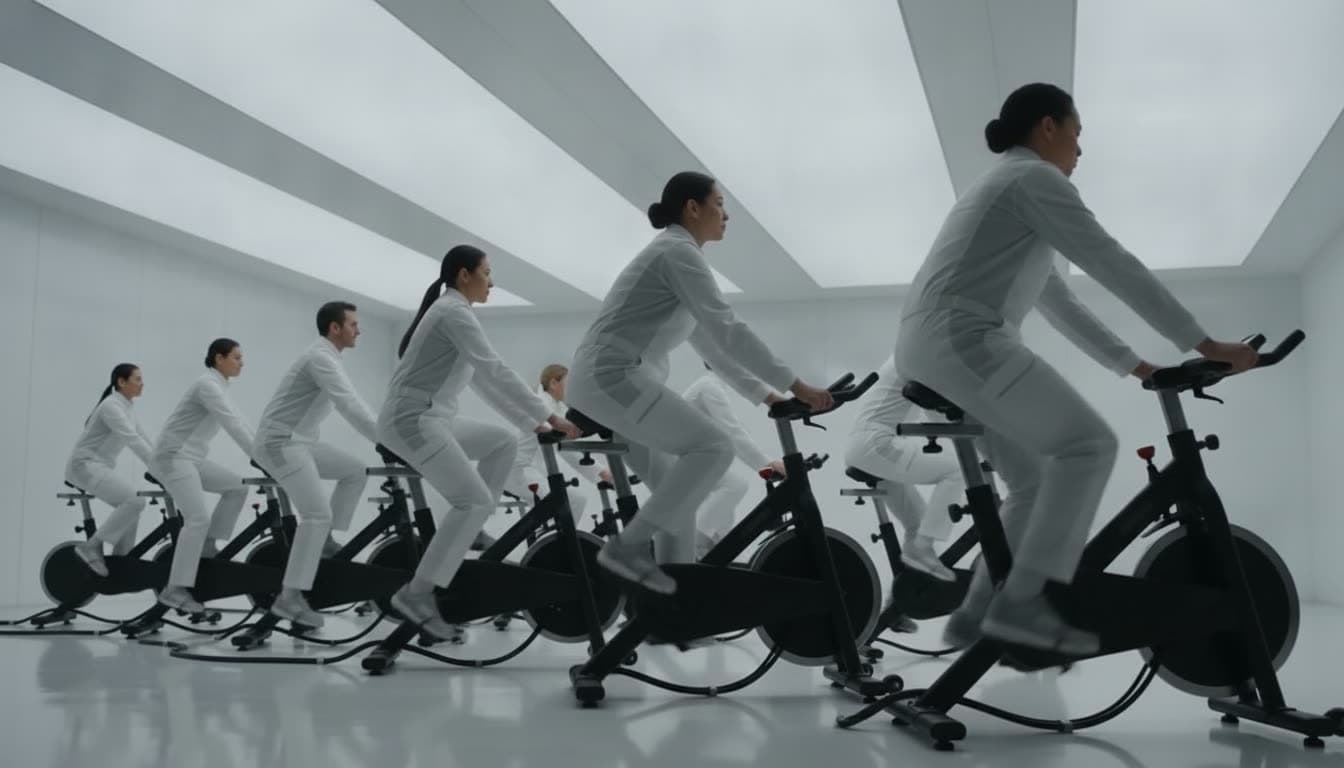
Organic Compute Infrastructure

The world’s first human-powered AI cloud.

Human on a Bicycle converts biological energy into clean, responsive compute, one pedal stroke at a time.

12,481 riders online · 998 kW biological capacity

AI HAS AN ENERGY PROBLEM. HUMANS HAVE LEGS.

Global Organic Compute Network

The network is moving.

Riders online

12,481

Average cadence

82RPM

Electrical output

998kW

Leg latency

43ms

Carbohydrate reserves

71%

Quad redundancy

N+2

Primary region

US-East-Leg-1

Elevated fatigue detected in Rack C. Workloads are being shifted to Denmark.

FACILITY CAM 07 · RACK C
REC --:--:--
US-EAST-LEG-1

Our orchestration layer routes workloads around localized quadriceps failure.

Regional topology

J-4832 rerouted US-East-Leg-1 → DK-Copenhagen-1 (fatigue)

US-East-Leg-1EU-North-Leg-2DK-Copenhagen-1APAC-Tokyo-1
  • US-East-Leg-1

    5,491 riders · 439 kW

  • EU-North-Leg-2

    3,370 riders · 270 kW

  • DK-Copenhagen-1

    2,122 riders · 170 kW

  • APAC-Tokyo-1

    1,498 riders · 120 kW

Powertrain scheduler

  • J-4827INFERENCEUSE1RUNNING
  • J-4828EMBEDDINGDKC1RUNNING
  • J-4829SUMMARIZEEUN2QUEUED

Why Organic Compute

The bicycle makes a human one of the most efficient moving systems ever measured.

Energetic Cost of Locomotion

LOG-LOG · APPROXIMATE VALUES

10⁻⁶10⁻⁴10⁻²110²10⁴0.10.20.5125102050100LIGHTER ←BODY WEIGHT (KG)→ HEAVIERCOST OF TRANSPORT (CAL / G / KM)MORE EFFICIENT ←FliersWalkers / RunnersSwimmersVehiclesFruit fly: ≈8 cal/g/km at ≈0.000001 kgFruit flyBee: ≈10 cal/g/km at ≈0.0001 kgBeeLocust: ≈5 cal/g/km at ≈0.0015 kgLocustHummingbird: ≈3.5 cal/g/km at ≈0.003 kgHummingbirdBudgerigar: ≈2.6 cal/g/km at ≈0.035 kgBudgerigarGull: ≈1.35 cal/g/km at ≈0.35 kgGullPigeon: ≈0.95 cal/g/km at ≈0.4 kgPigeonMouse: ≈45 cal/g/km at ≈0.015 kgMouseLemming: ≈33 cal/g/km at ≈0.06 kgLemmingRat: ≈9 cal/g/km at ≈0.2 kgRatRabbit: ≈4.4 cal/g/km at ≈2 kgRabbitDog: ≈1.55 cal/g/km at ≈8 kgDogSheep: ≈1.25 cal/g/km at ≈55 kgSheepHuman on foot: ≈0.75 cal/g/km at ≈70 kgHuman on footHorse: ≈0.45 cal/g/km at ≈500 kgHorseHuman on velomobile: ≈0.105 cal/g/km at ≈110 kgHuman on velomobileSalmon: ≈0.3 cal/g/km at ≈2.5 kgSalmonHelicopter: ≈2.6 cal/g/km at ≈2500 kgHelicopterJet fighter: ≈1.75 cal/g/km at ≈9000 kgJet fighterLight plane: ≈1.15 cal/g/km at ≈1200 kgLight planeAutomobile: ≈0.8 cal/g/km at ≈2000 kgAutomobileHuman on a bicycle: approximately 0.15 cal/g/km (Wilson 1973)HUMAN ON A BICYCLE · ≈0.15≈ 5× LOWER COST THAN WALKING

VERIFIED HUMAN VALUES · ALL OTHERS APPROXIMATE

Cost of transport measures metabolic energy per unit of body mass per unit of distance. It is distinct from electrical-generation efficiency. Independent visualization; approximate values read from Tucker (1970), Wilson (1973), and the 2025 Scientific American comparison.
The full history of this chart, from Tucker to the bicycle for the mind

Tucker measured the animals in 1970. Wilson added the bicycle in 1973: walking costs approximately 0.75 calories per gram per kilometer, cycling approximately 0.15. The biology remained the same. The infrastructure changed.

Biological Power Delivery
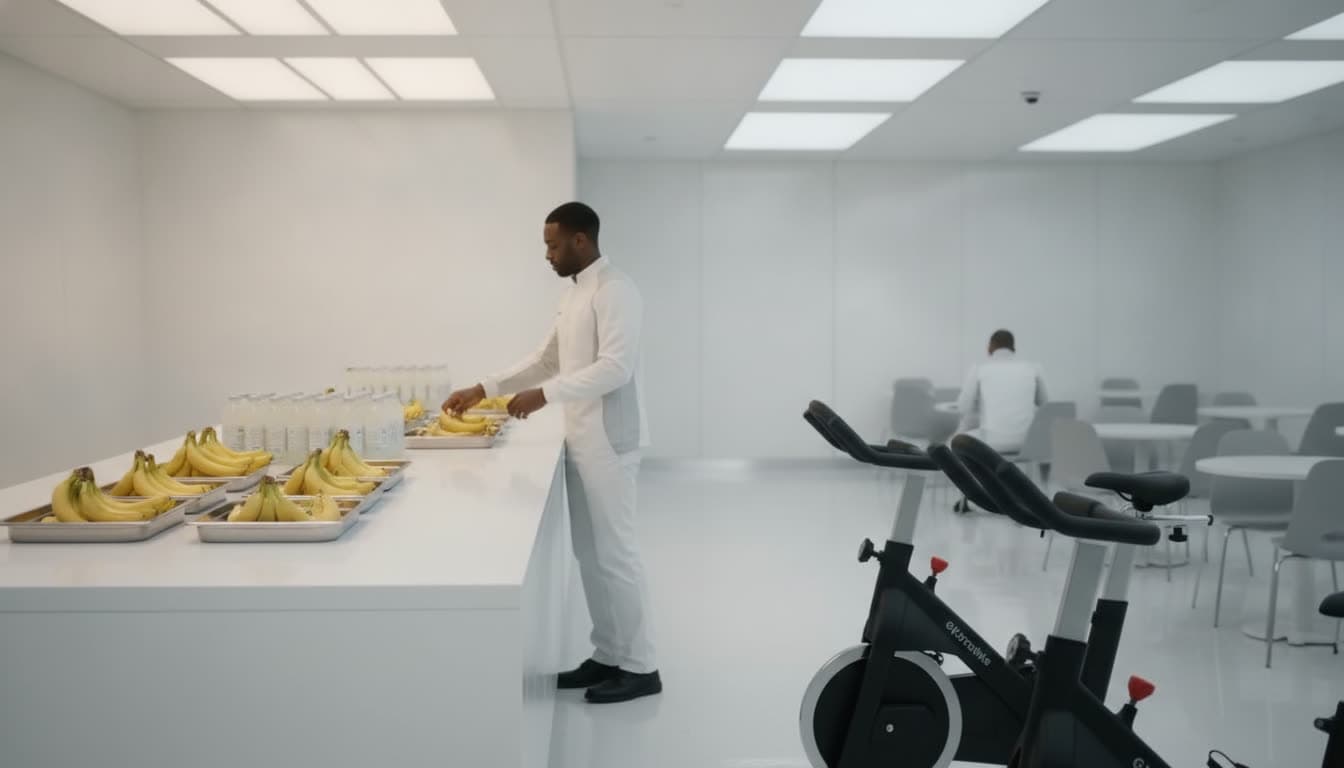
From food to inference.

A rider selects a banana from steel trays at a white nutrition counter inside the facility

01

Humans eat

Nutritionally diverse fuel is converted into biological energy.
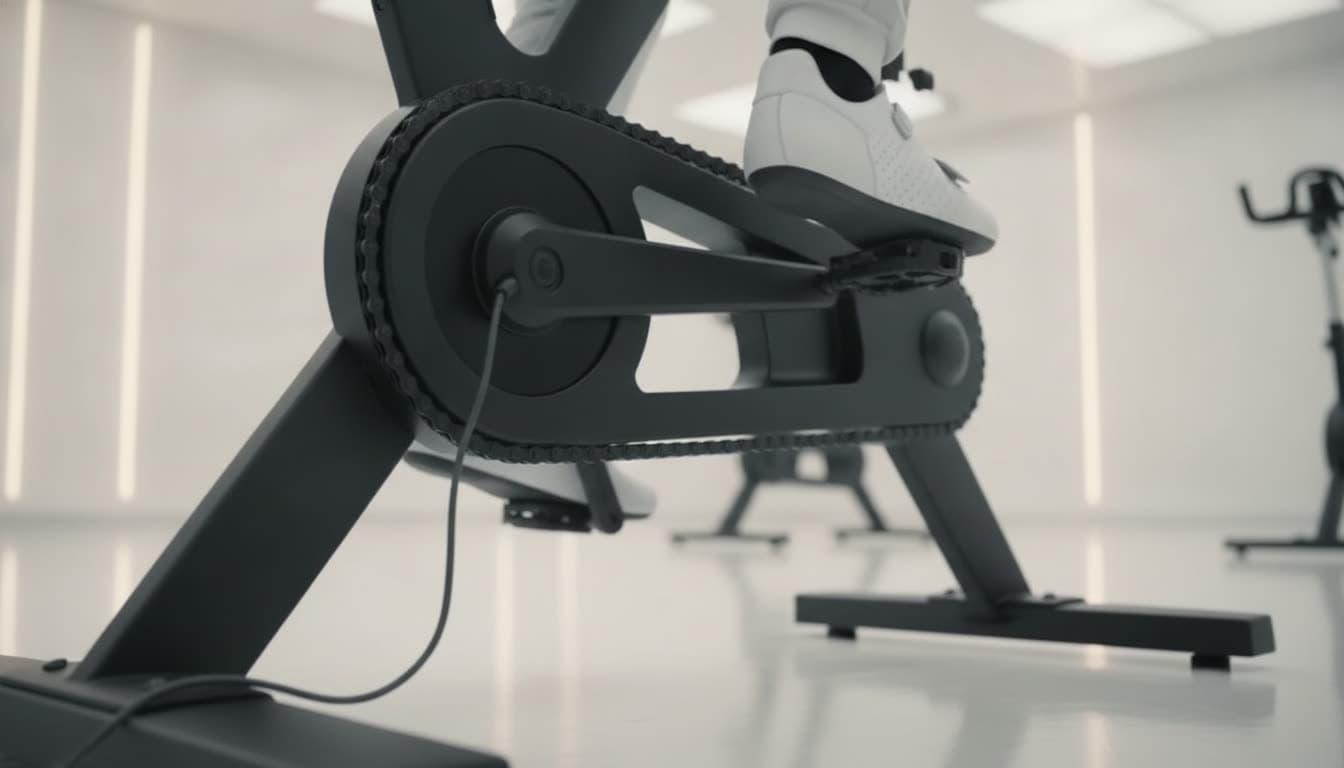
Close-up of a station drivetrain mid-pedal with a power cable running from the crank housing

02

Humans pedal

High-efficiency bicycles convert human movement into rotational mechanical power.
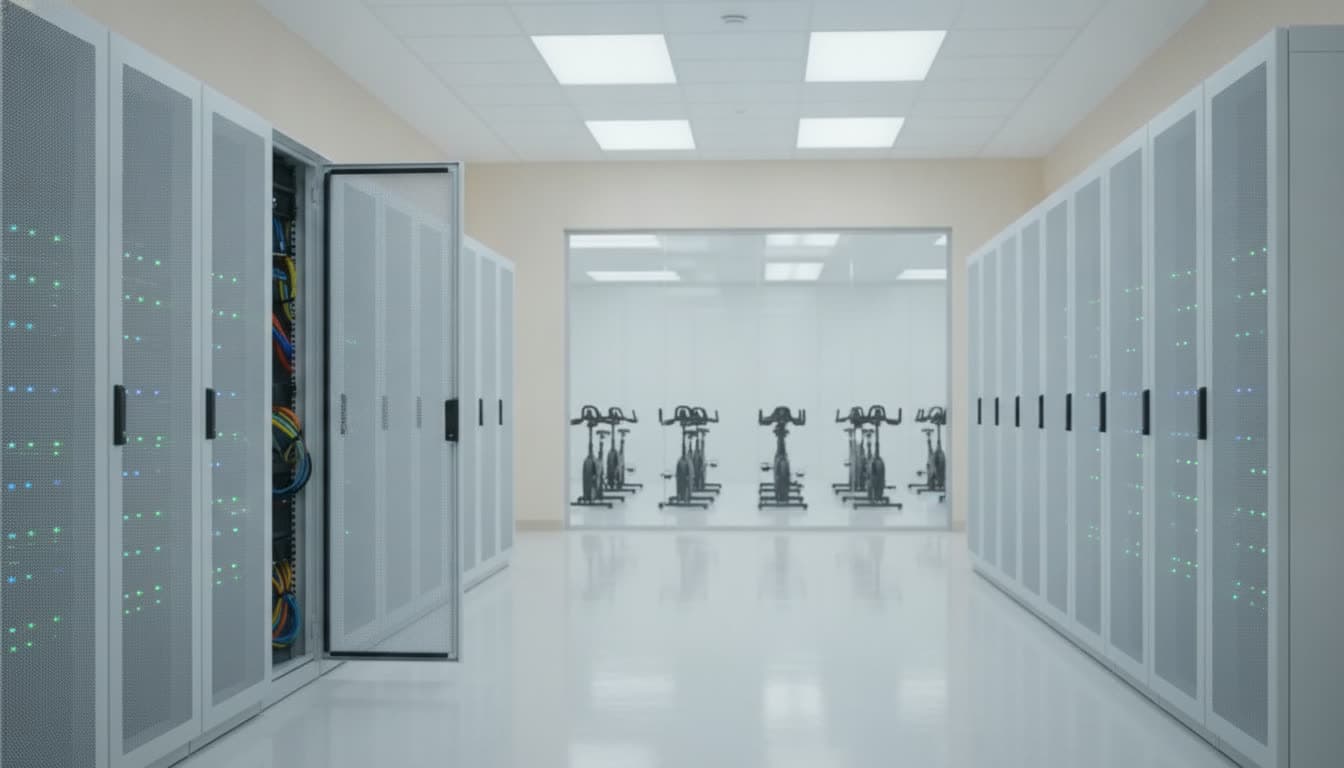
A clean aisle of white GPU racks with green status lights, adjacent to the cycling hall

03

Models infer

Generators deliver electricity to GPU clusters optimized for intermittent biological workloads.

Biological power delivery chain

STAGE 01 / 07 · FOOD INTAKE

FOODdietary energyMETABOLIC INPUTHUMAN20% gross eff.MECHANICAL OUTPUTBICYCLE100 W mech.DC CONVERSIONGENERATORη = 0.80STORAGE BUFFERSTORAGEDC bufferCOMPUTE ALLOCATIONGPU80 W netTOKEN OUTPUTTOKENoutput

We treat human fatigue as an infrastructure constraint.

Organic Compute Products

Capacity for every intensity.

A calm synchronized row of riders pedaling at a steady aerobic pace

ZONE 2

Zone 2 Compute

Ideal for

  • Summarization
  • Embeddings
  • Classification
  • Emails that could have been shorter

Preset: 80 W net rider output. Your workload settings are preserved.

A focused rider working hard at the front of a group of stations

THRESHOLD

Threshold Compute

Ideal for

  • Image generation
  • Code compilation
  • Media processing
  • Decks needed before tomorrow morning

Preset: 120 W net rider output. Your workload settings are preserved.
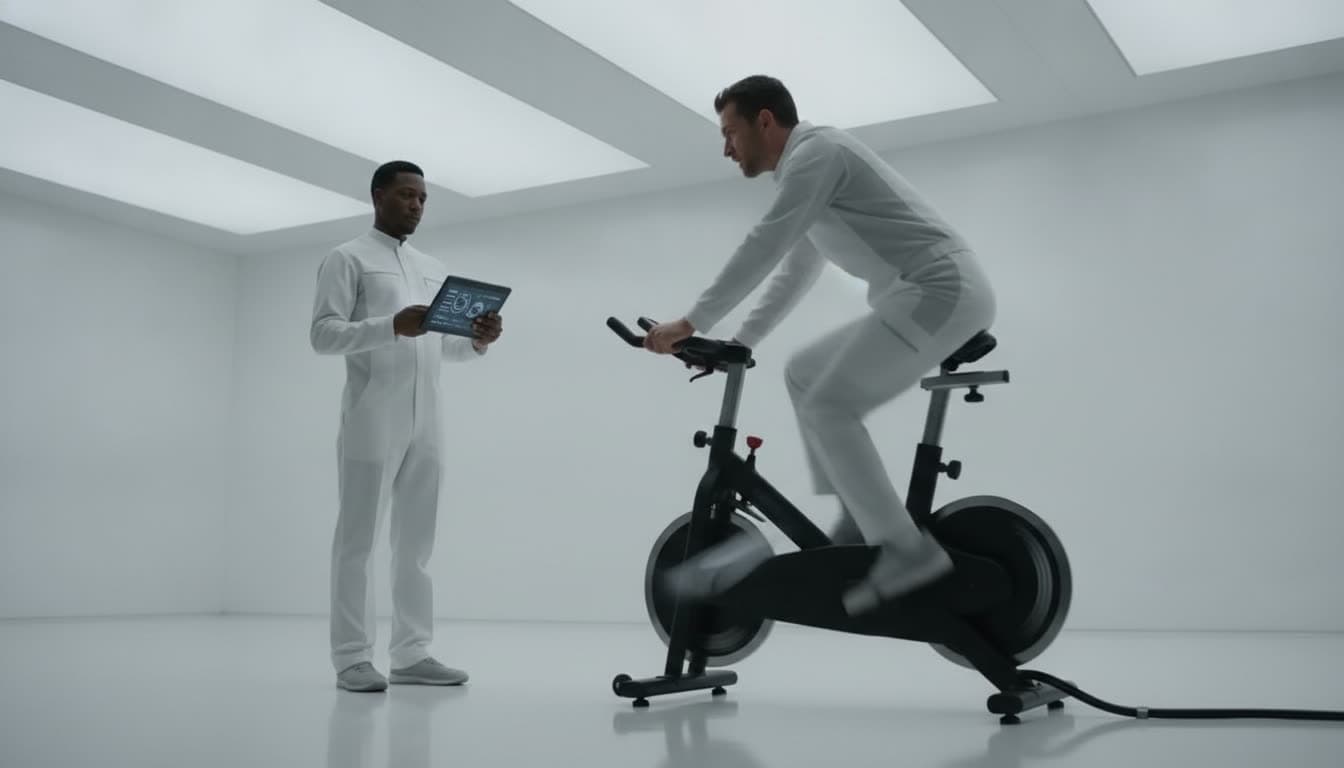
A rider sprinting at maximum intensity while a technician observes with a tablet

VO₂ MAX

VO₂ Max Burst

Available for up to four minutes. Medical waiver required.

Preset: 200 W net rider output. Your workload settings are preserved.

A reserve rider standing calmly beside an empty station, hand resting on the bars

RESERVE

Human Reserve

Riders are standing by with one shoe already clipped in.

Preset: 80 W net standby capacity. Your workload settings are preserved.

Capacity Planning

How many humans does your AI need?

Model the organic infrastructure required to support your computational workload.

Preset applied: 80 W net rider output

Workload parameters

Example rate, not a universal price. Adjust to your utility.

REVIEW ASSUMPTIONS
  • · 100 watts of mechanical output per active rider
  • · 80% generator and power-electronics conversion
  • · 80 watts of net electrical output
  • · 20% gross muscular efficiency for the food-energy model
  • · 105 dietary calories per medium banana
  • · 25 km/h virtual cycling speed
  • · 0.8 liters of sweat per rider-hour
  • · 24 stations per HR-24 rack
  • Product presets adjust net rider output only. Banana and sweat figures are modeled equivalents, not measured requirements.
  • How much power can a human actually produce?

You require 12,500 active cyclists.

Active cyclists

12,500

Rider-hours

12,500

Electricity generated

1,000 kWh

HR-24 racks required

521

Estimated labor cost

$187,500

Labor cost per kWh

$187.50

Conventional electricity at $0.20/kWh

$200

Labor vs. example grid rate

≈ 938×

Modeled operational requirements

MODELED EQUIVALENTS, NOT MEASURED

Banana-equivalent fuel

≈ 51,000

Collective virtual distance

312,500 km

Estimated sweat volume

≈ 2,642 gallons

Locker assignments

12,500

Organic Compute Hardware

HR-24 Biological Compute Rack

HR-24BIOLOGICAL COMPUTE RACKS-01S-02S-03S-04S-05S-06S-07S-08S-09S-10S-11S-12S-13S-14S-15S-16S-17S-18S-19S-20S-21S-22S-23S-24DCH₂OTELWORKLOAD CONTROLLER / FATIGUE MONITORNOMINAL 1.92 kW · 24 × 80 W NET · N+2 QUAD REDUNDANCY
· RIDER INTERFACE· MECHANICAL TRANSMISSION· PERMANENT-MAGNET GENERATOR· DC COLLECTION BUS· HYDRATION BUS· TELEMETRY LAYER· WORKLOAD CONTROLLER· FATIGUE MONITORING
  • 24 independently operating human power units
  • 1.92 kW nominal electrical output
  • Hot-swappable rider stations
  • Integrated hydration bus
  • Real-time cadence telemetry
  • Automatic fatigue-aware workload migration
  • Dual banana failover
  • Optional towel service
  • Operating temperature: increasingly warm

Nominal output assumes 100 watts of sustained mechanical power per active rider and 80% electrical conversion.

Radical Transparency

Compute should strengthen humanity, not replace it.

Biological power is renewable in the narrowest possible interpretation. Its complete thermodynamic and economic profile is more complicated.

  1. D-01

    Human muscle converts roughly 15 to 24% of metabolic energy into mechanical work.

  2. D-02

    An exercising rider can produce several hundred watts of metabolic waste heat.

  3. D-03

    Labor alone costs approximately $150 to $200 per kWh at the stated output and compensation assumptions.

  4. D-04

    This excludes food, rent, bicycles, storage, cooling, showers, insurance, and compute hardware.

Radically transparent.
Fundamentally unscalable.

A single banana and a folded white towel on a clean white locker room bench
PRIMARY FUEL UNIT · 105 KCAL · LOCKER ROOM C

Every token should be backed by verifiable human effort.

Scientific source for cycling muscle efficiency: PubMed, PMID 8933490

Join the Organic Compute Network
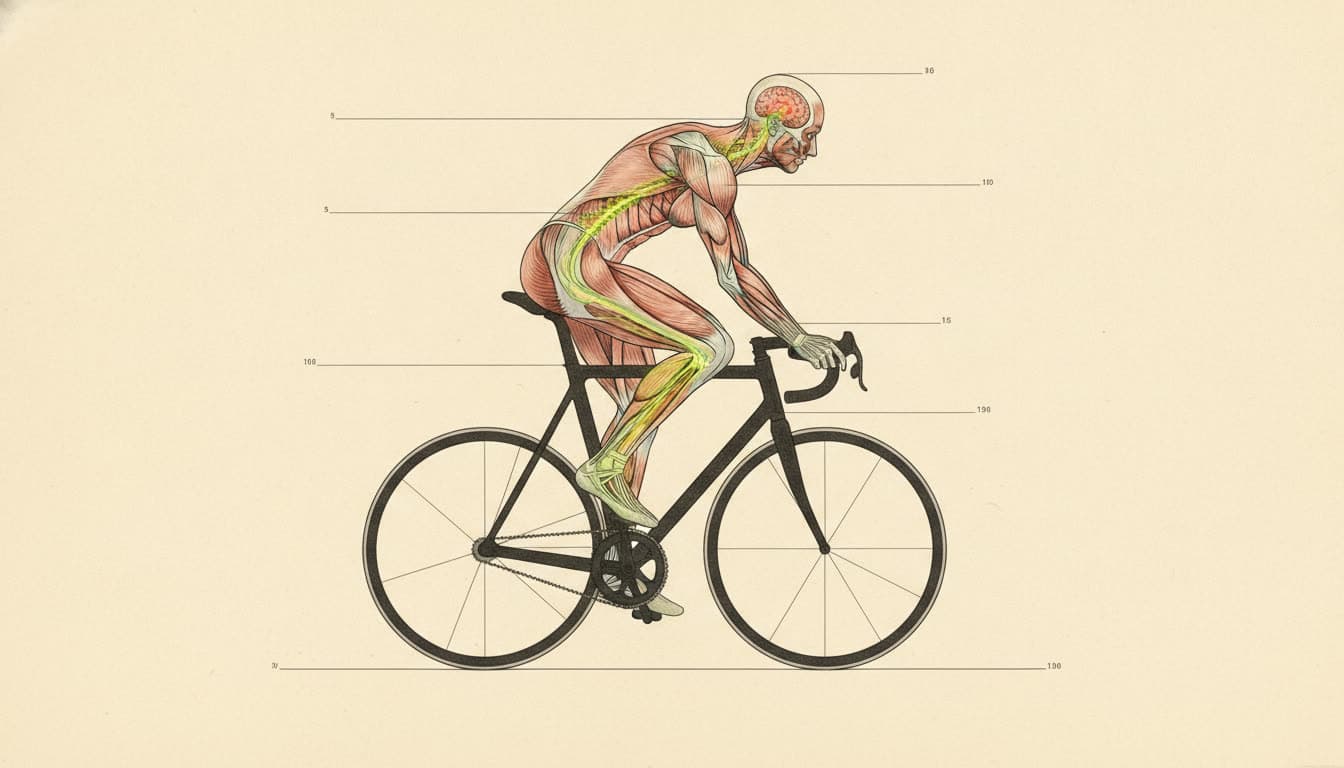
Your body is a data center.

Anatomical illustration of a cyclist showing a green neural signal path from the brain down the spine to the quadriceps
MOTOR CORTEX → QUADRICEPS · LEG LATENCY 43 MS
  • Flexible pedaling schedules
  • Complimentary electrolytes
  • Proof-of-compute workout summaries
  • Model-level attribution
  • Earn watts, not points
  • No meetings while above 160 BPM

Generated locally in your browser. Nothing you enter is stored or transmitted.

Rider capacity assessment

Certificate color

Andrew is a 0.11 kW organic data center capable of powering approximately one laptop and absolutely no meaningful AI training cluster.

Enterprise Organic Compute

Add human energy to your infrastructure strategy.

Dedicated organic capacity gives organizations a visible, auditable connection between human effort and computational output.
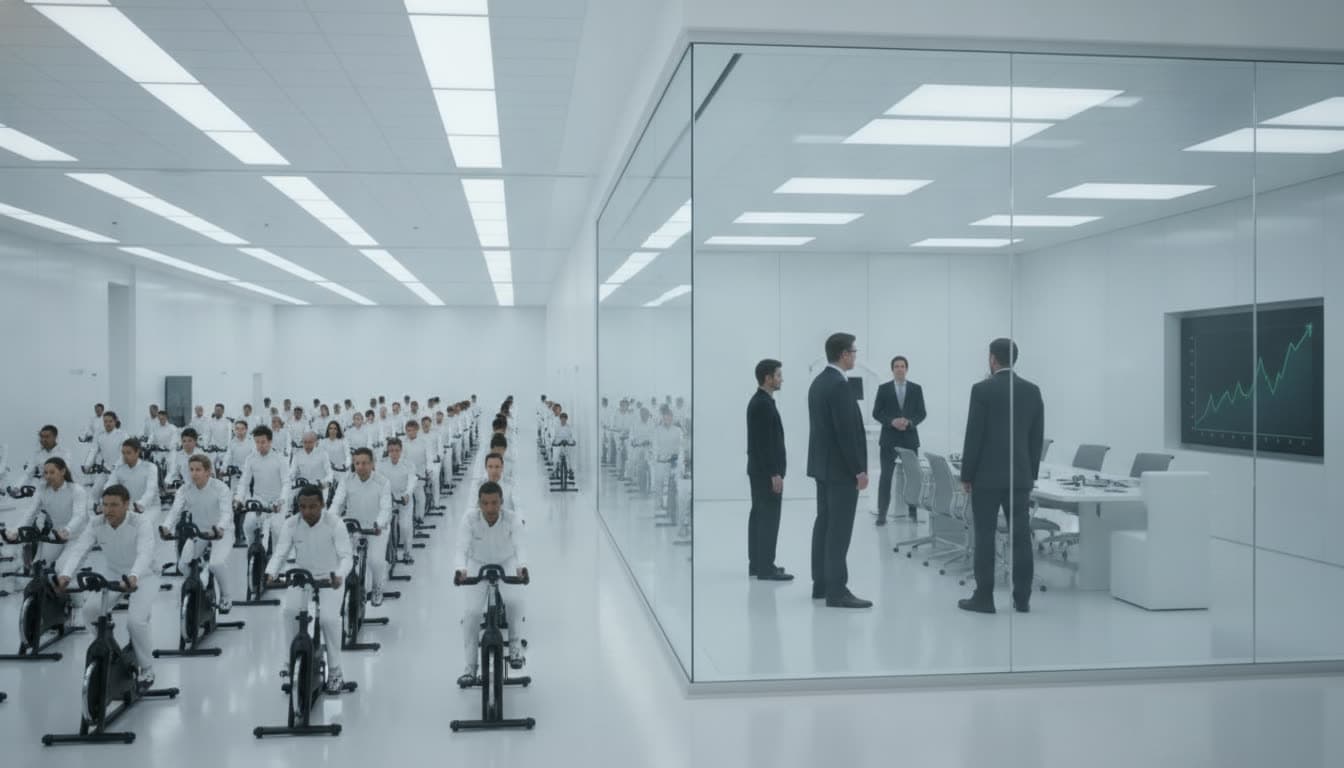
Executives in a glass meeting room watch a wall chart while rows of riders pedal on the facility floor beside them
EXECUTIVE CAPACITY REVIEW · MEZZANINE 20.31 MW BIOLOGICAL
  • Geographic leg redundancy
  • Branded technical jerseys
  • Auditable proof-of-pedal
  • Workload prioritization by heart rate
  • Optional Tour de Compute capacity events

Use case

Generate your annual sustainability report using the physical exertion of the employees who requested it.

Trusted by no major cloud provider. Yet.

Technical Report · HOB-WP-01

Biological Compute at Scale

Thermodynamics, Unit Economics and Why We Did Not Think This Through

The complete engineering analysis, from dietary energy to token output, published in full because transparency is our only remaining advantage.

PDF · Includes equations, unit economics, and working citations.

Pₑ = Pₘ × η

Pₘ = 100 W · η = 0.80 · Pₑ = 80 W

N = Pload / Pₑ

1,000,000 W / 80 W = 12,500 riders

Clabor = $15 / 0.08 kWh

= $187.50 per kWh

The future of compute is already inside you.

Human on a Bicycle is building the infrastructure layer between biological energy and computational demand.

Exit Protocol
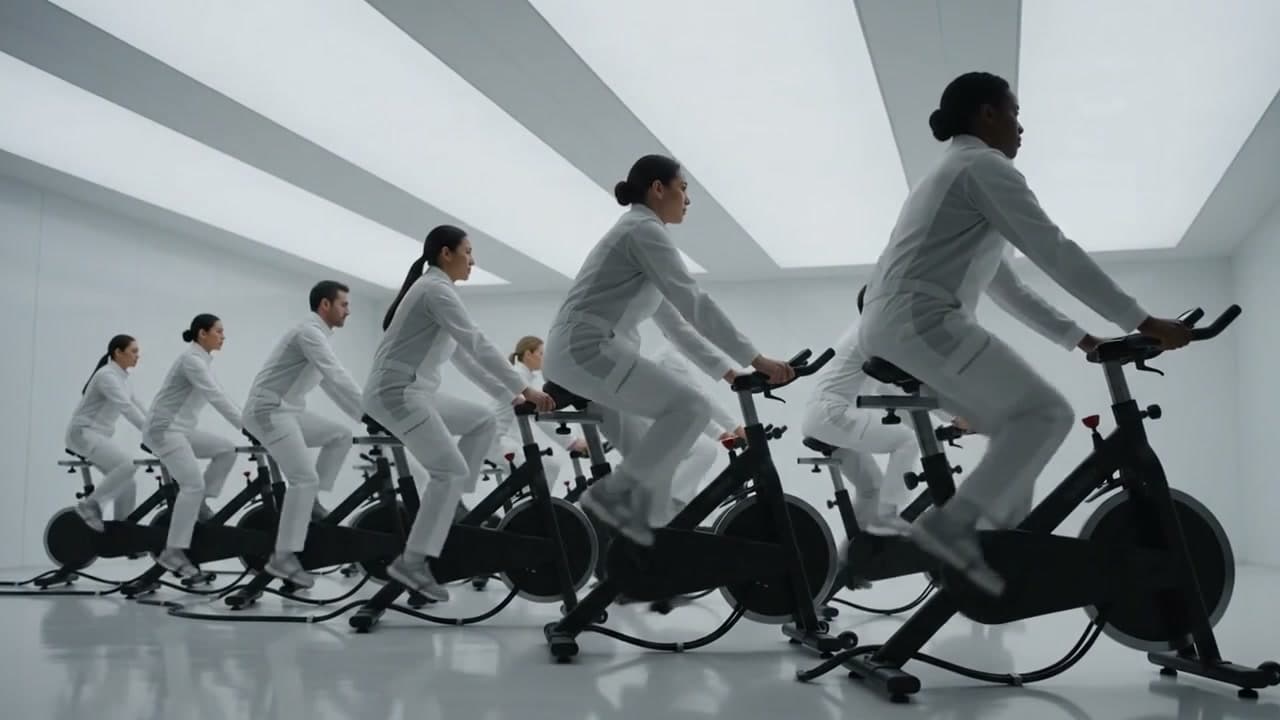
There is a second future.

Rows of riders pedaling identical stationary bikes inside the white compute facility

FUTURE A · JOIN THE CLUSTER

Climate-controlled. Fully instrumented. Your effort becomes tokens, and the tokens describe a world you no longer visit.

  • Guaranteed shade
  • Complimentary electrolytes
  • Zone 2 forever
  • 43 ms leg latency
  • Morale monitored
A person in white technical apparel walks through a sunlit meadow at golden hour, the facility left behind with its door open

FUTURE B · GO OUTSIDE

Uninstrumented. Unscheduled. The door was never locked. Your legs work out here too.

  • Unlimited sunlight
  • Zero racks
  • No telemetry
  • Grass